Python debugging
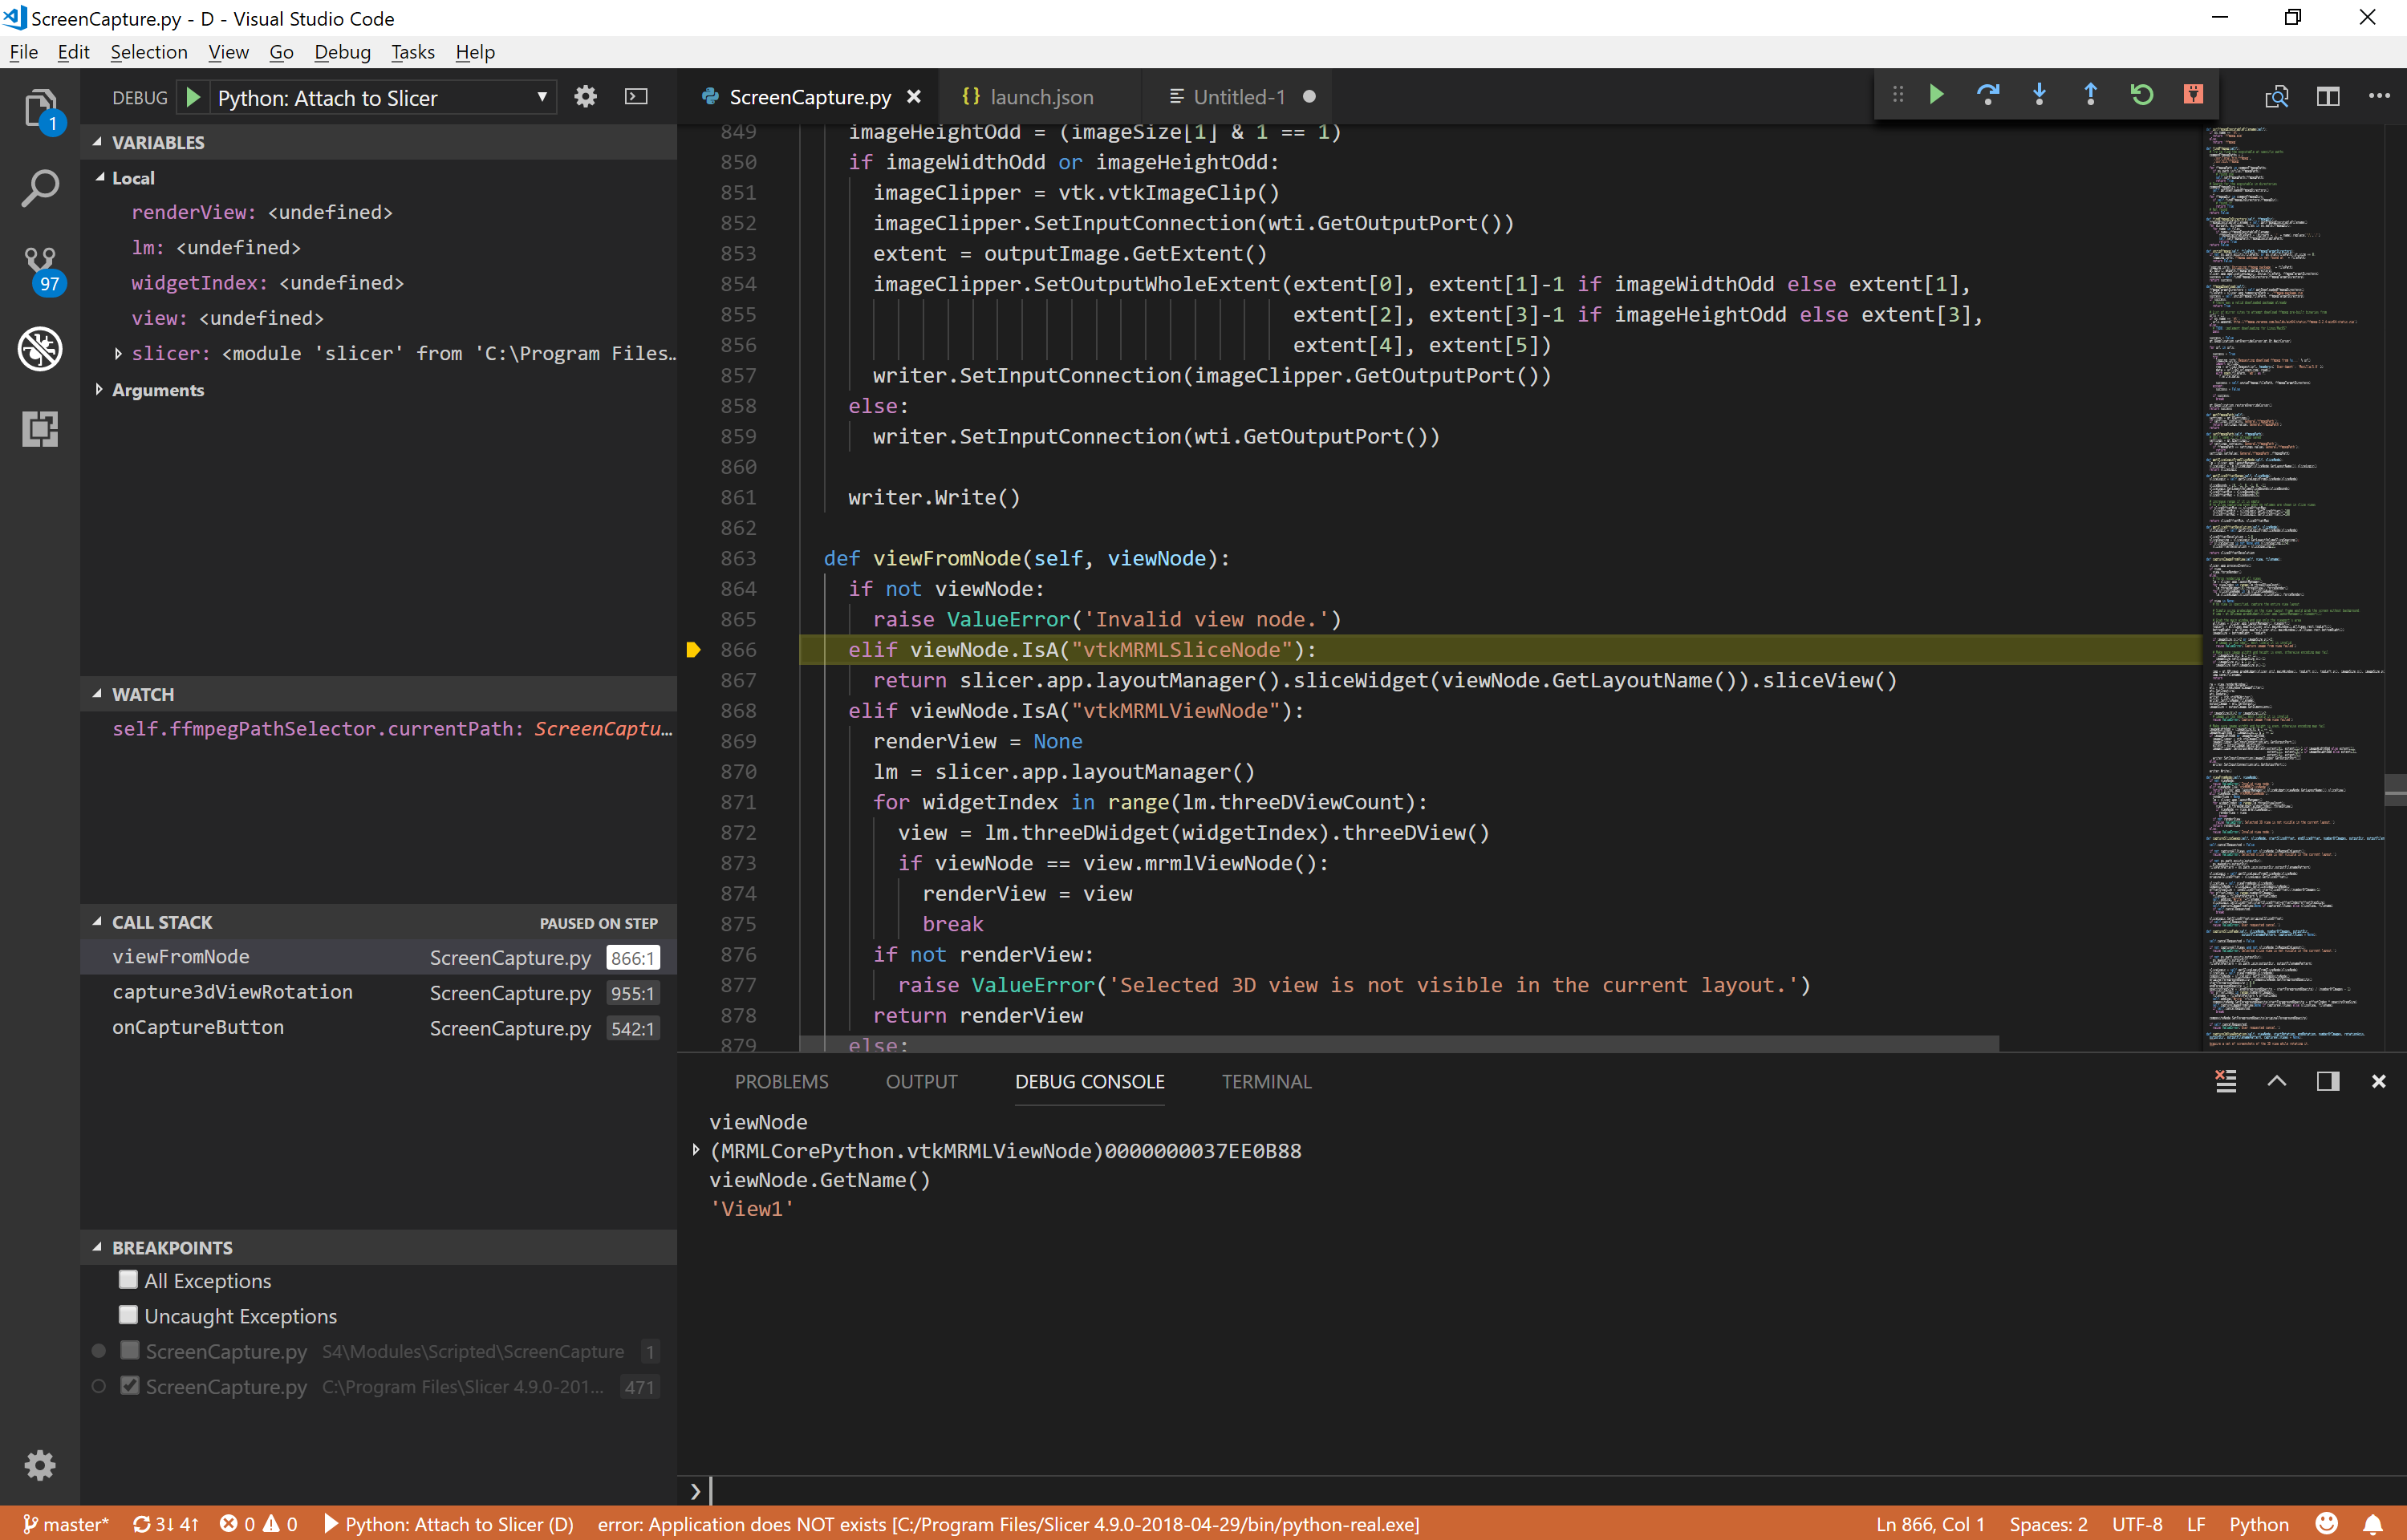
Python code running in Slicer can be debugged (execute code line-by-line, inspect variables, browse the call stack, etc.) by attaching a debugger to the running Slicer application. Detailed instructions are provided in documentation of DebuggingTools extension.
Profiling
The following code snippet can be used to get detailed performance analysis Python code:
# Start profiling
detailedProfiling = True  # set to False to just get elapsed time
if detailedProfiling:
    import cProfile
    cp=cProfile.Profile()
    cp.enable()
else:
    startTime = time.time()

# --------------------------------------------
# Put the tested code here, for example:
import SampleData
sampleDataLogic = SampleData.SampleDataLogic()
mrHead = sampleDataLogic.downloadMRHead()
import SegmentStatistics
segStatLogic = SegmentStatistics.SegmentStatisticsLogic()
# --------------------------------------------

# Finish profiling and display result
if detailedProfiling:
    profileFilePath = os.path.join(slicer.app.temporaryPath, 'profile.prof')
    cp.disable()
    cp.dump_stats(profileFilePath)
    # Import visualization tool
    pip_install('snakeviz')
    import snakeviz
    # Show profiling results in the web browser
    import shutil
    pythonSlicerExecutablePath = shutil.which("PythonSlicer")
    commandLine = [pythonSlicerExecutablePath, "-m", "snakeviz", profileFilePath]
    proc = slicer.util.launchConsoleProcess(commandLine, useStartupEnvironment=False)
    # proc.kill()
else:
    stopTime = time.time()
    print(f"Elapsed time: {stopTime-startTime} s")
Detailed profiling result is shown in the default web browser:
